Annex
Contents
Annex#
Charts of selected variables relevant to the report.
Harvest Index#
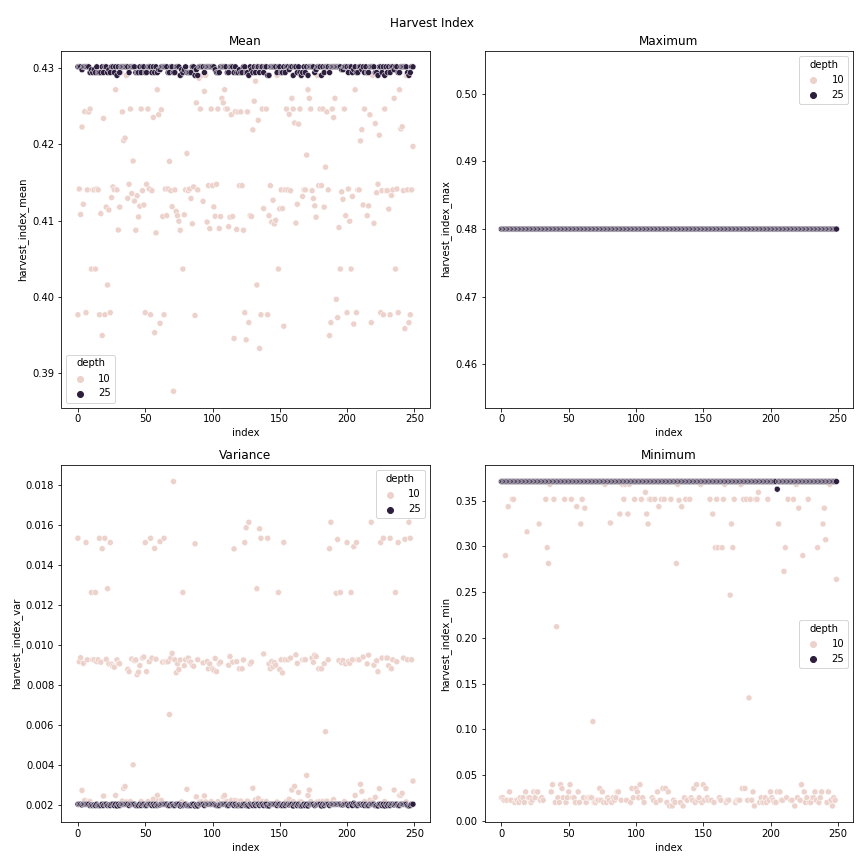
Fig. 9 Fig. 4 Aggregation of 250 runs each of 10 mm and 25 mm irrigation depths with irrigation dates chosen randomly from the intervals [15 Jan, 15 Mar] and [16 Mar, 15 May]#
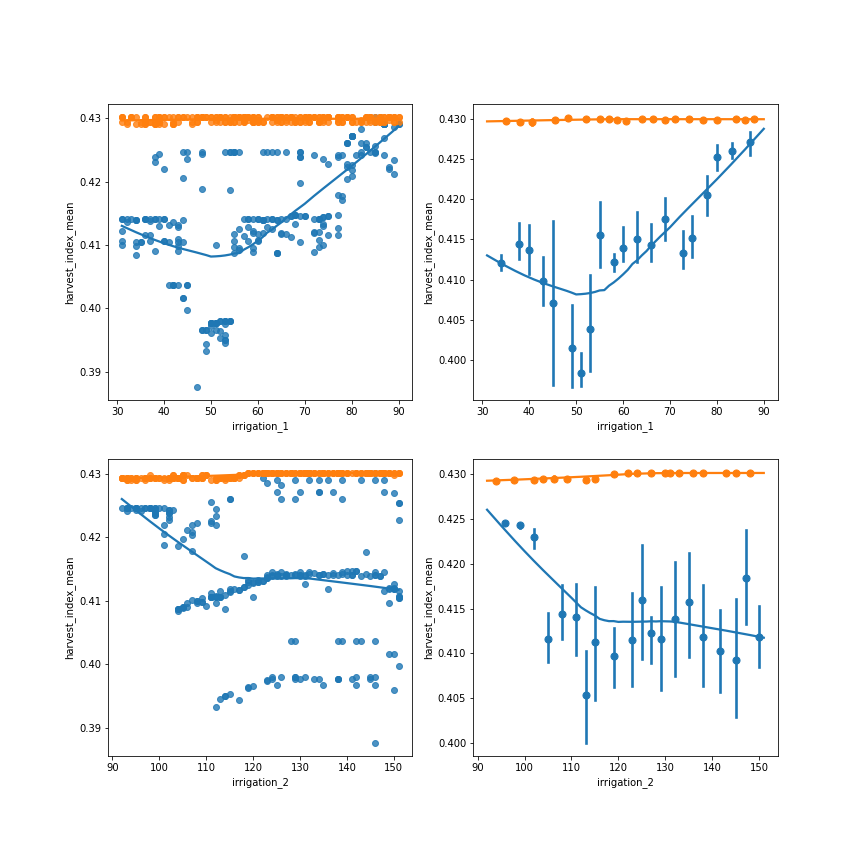
Fig. 10 Regression plot of 250 runs of 10 mm and 25 mm irrigation depths irrigation dates chosen randomly from the intervals [15 Jan,15 Mar] and [16 Mar,15 May] Top represent plots against the first irrigation date, Bottom row plots against the second irrigation date. Organge is 25 mm irrigation, blue is 10 mm irrigation.#
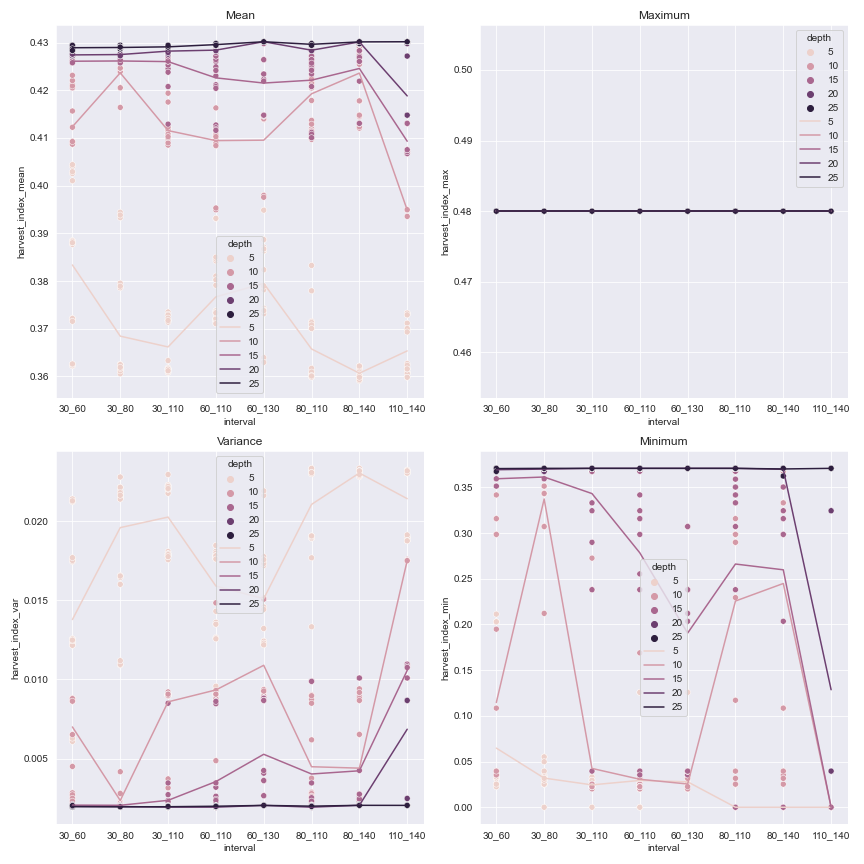
Fig. 11 Different statistics for each chosen interval. The scatter plots represent the actual values for each random date pair, the line represents the mean value in each plot.#
Canopy Cover#
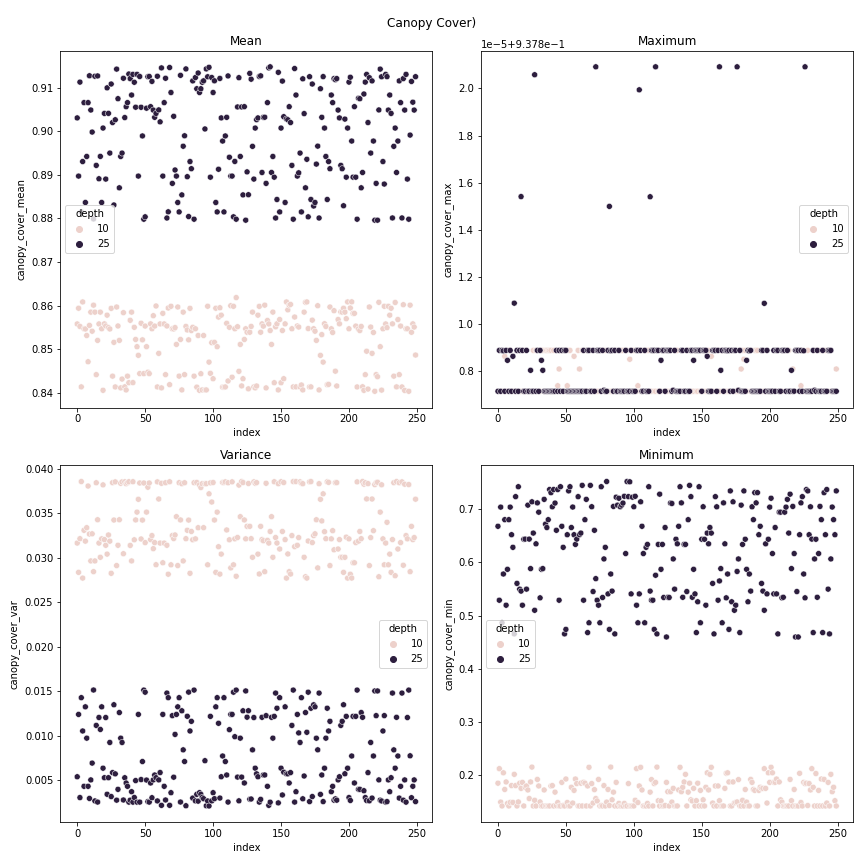
Fig. 12 Aggregation by growing season of 250 runs of 10 mm and 25 mm irrigation depths with irrigation dates chosen randomly from the intervals [15 Jan,15 Mar] and [16 Mar,15 May]#
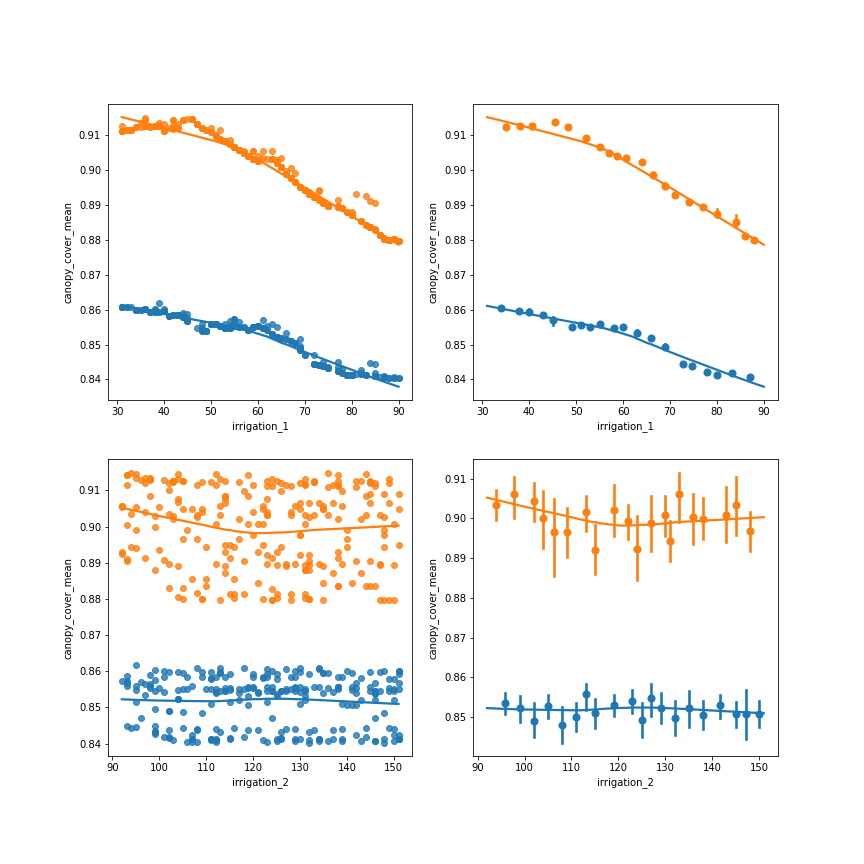
Fig. 13 Regression plot of 250 runs of 10 mm and 25 mm irrigation depths irrigation dates chosen randomly from the intervals [15 Jan,15 Mar] and [16 Mar,15 May] Top represent Yield against the first irrigation date, Bottom row represents yield versus the second irrigation date. Organge is 25 mm irrigation, blue is 10 mm irrigation.#
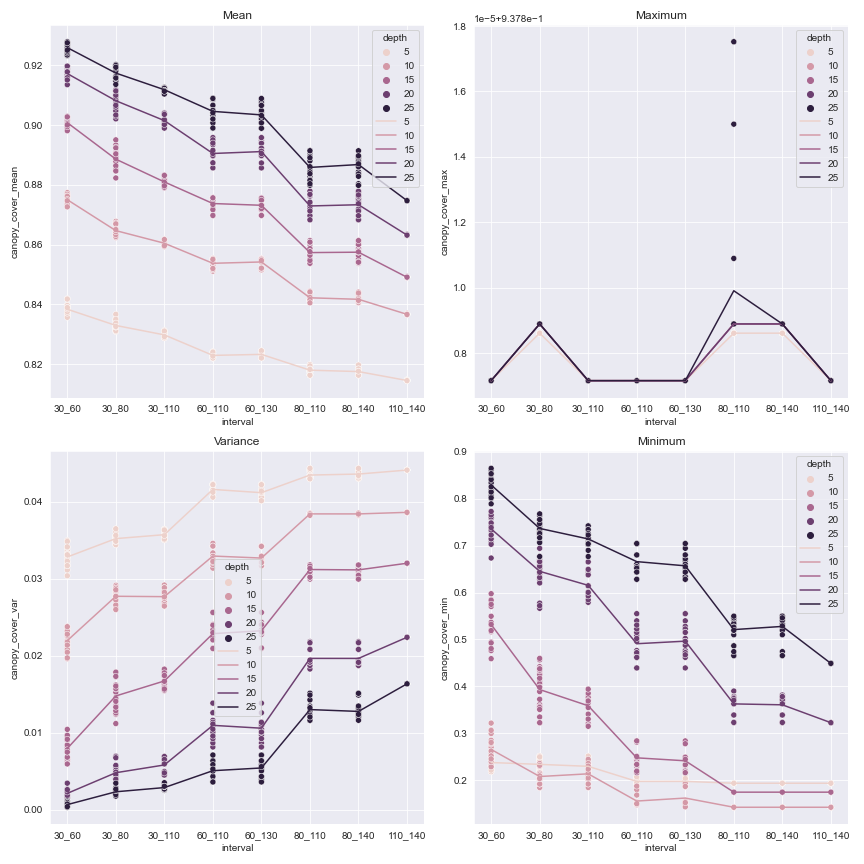
Fig. 14 Different statistics representing the canopy cover for each chosen interval. The scatter plots represent the actual values for each random date pair, the line represents the mean value in each plot.#
Transpiration#
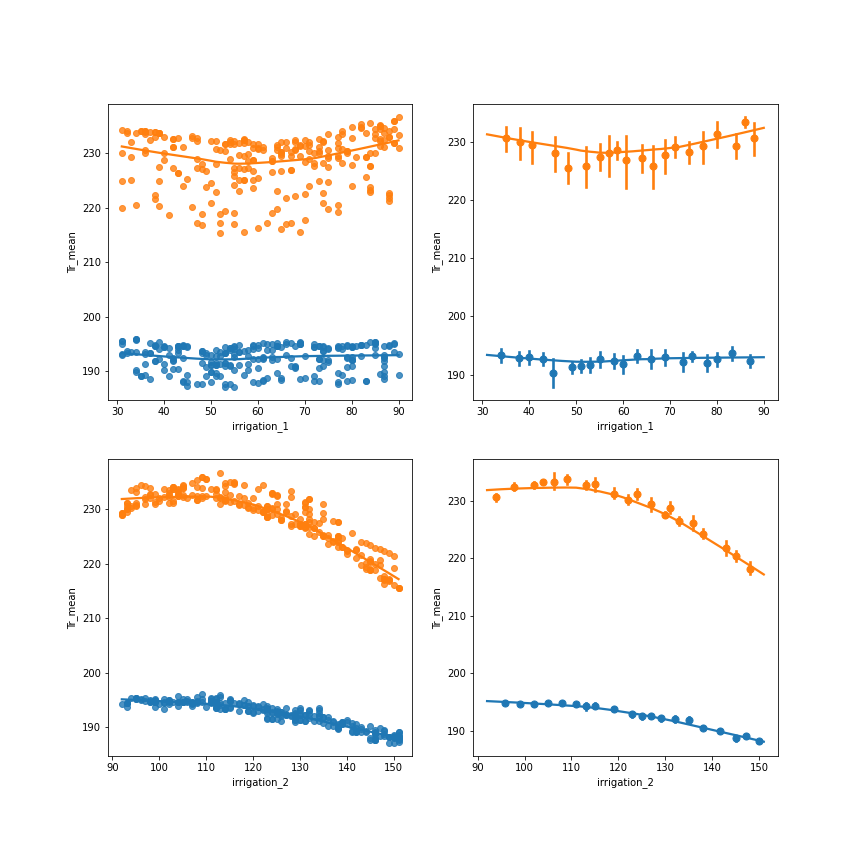
Fig. 15 Regression plot of 250 runs of 10 mm and 25 mm irrigation depths irrigation dates chosen randomly from the intervals [15 Jan,15 Mar] and [16 Mar,15 May] Top represent plots against the first irrigation date, Bottom row plots against the second irrigation date. Organge is 25 mm irrigation, blue is 10 mm irrigation.#
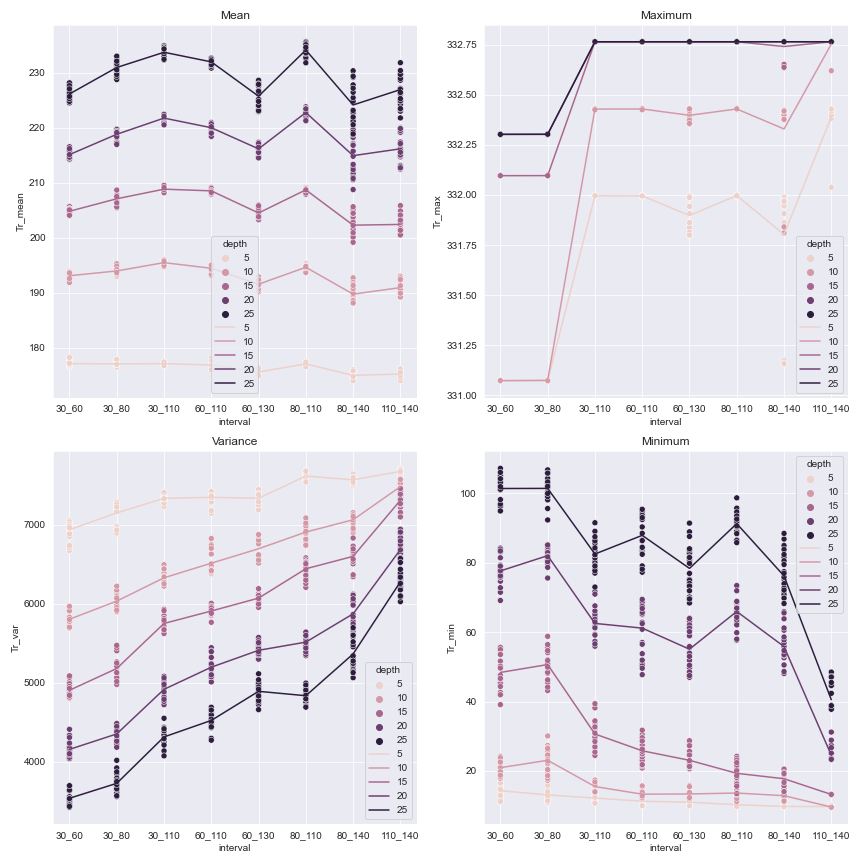
Fig. 16 Different statistics for each chosen interval. The scatter plots represent the actual values for each random date pair, the line represents the mean value in each plot.#
Deep Percolation#
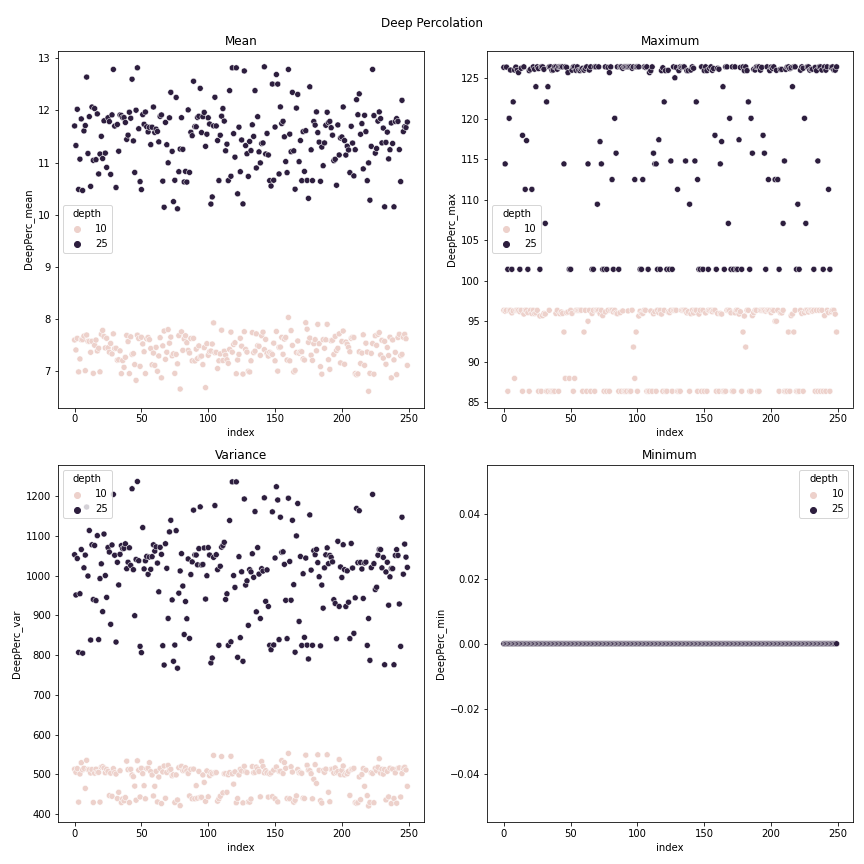
Fig. 17 Fig. 4 Aggregation of 250 runs each of 10 mm and 25 mm irrigation depths with irrigation dates chosen randomly from the intervals [15 Jan, 15 Mar] and [16 Mar, 15 May]#
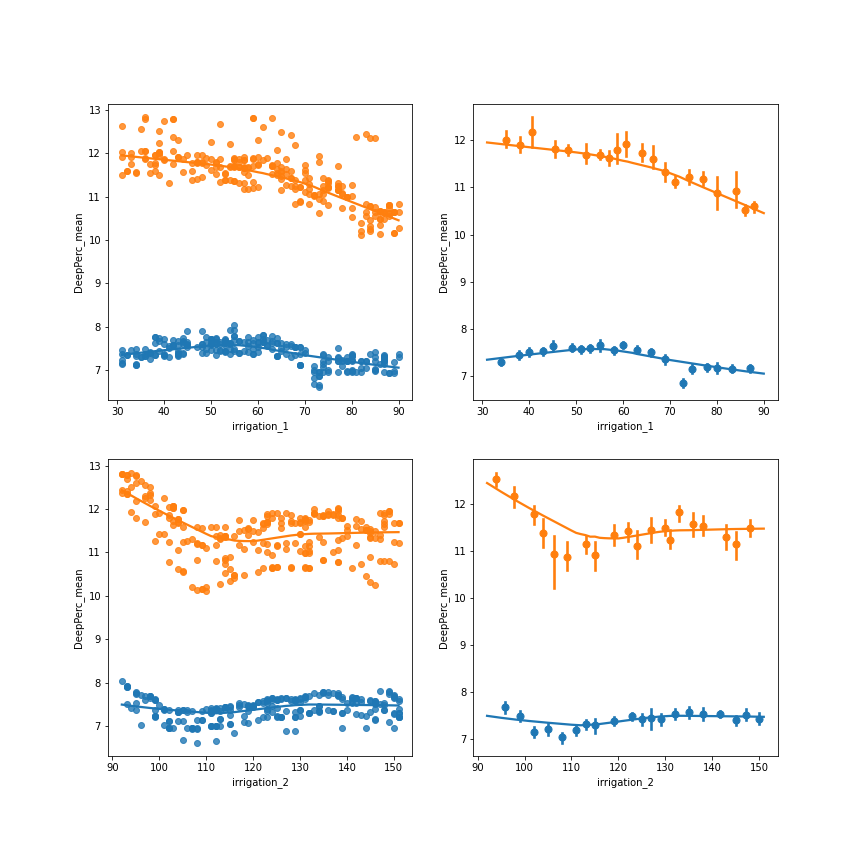
Fig. 18 Regression plot of 250 runs of 10 mm and 25 mm irrigation depths irrigation dates chosen randomly from the intervals [15 Jan,15 Mar] and [16 Mar,15 May] Top represent plots against the first irrigation date, Bottom row plots against the second irrigation date. Organge is 25 mm irrigation, blue is 10 mm irrigation.#
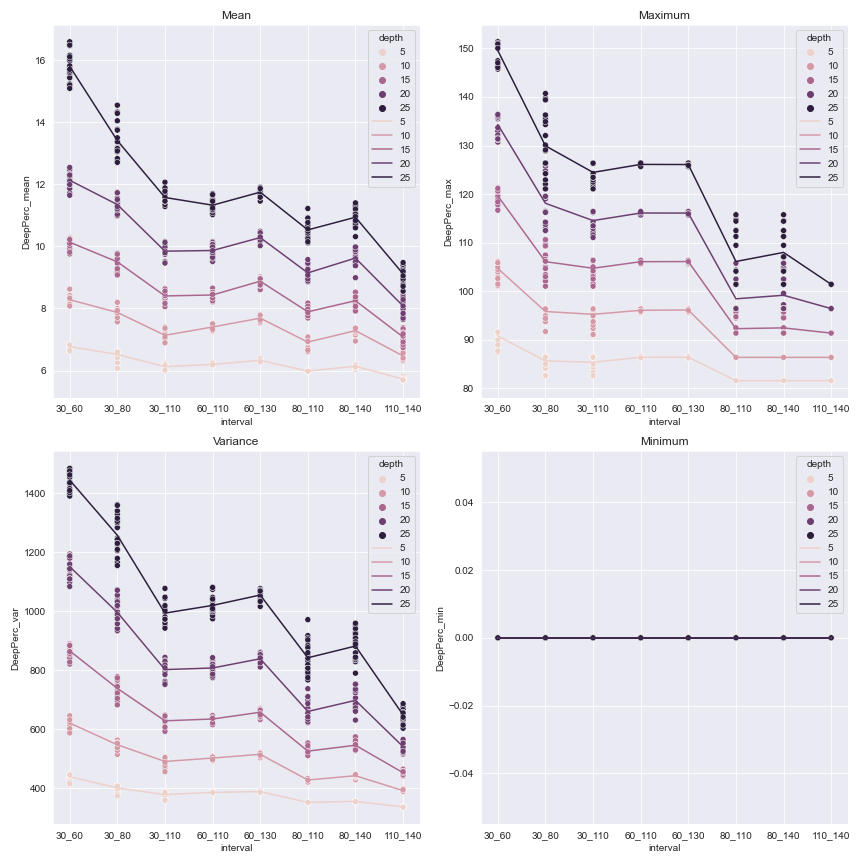
Fig. 19 Different statistics for each chosen interval. The scatter plots represent the actual values for each random date pair, the line represents the mean value in each plot.#
Surface Evaporation#
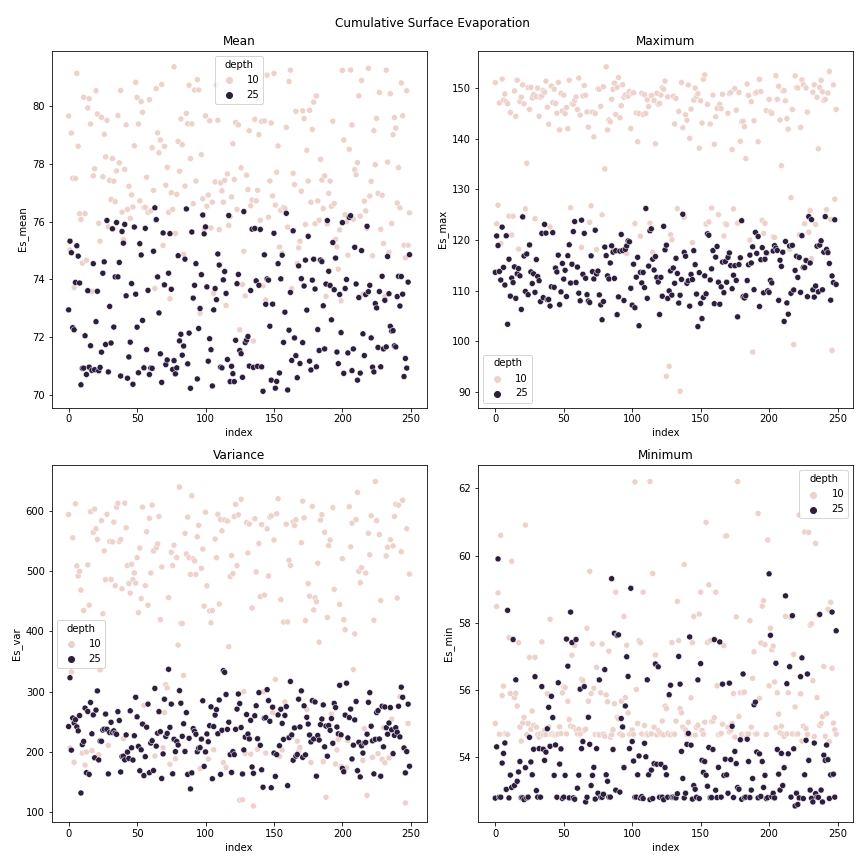
Fig. 20 Fig. 4 Aggregation of 250 runs each of 10 mm and 25 mm irrigation depths with irrigation dates chosen randomly from the intervals [15 Jan, 15 Mar] and [16 Mar, 15 May]#
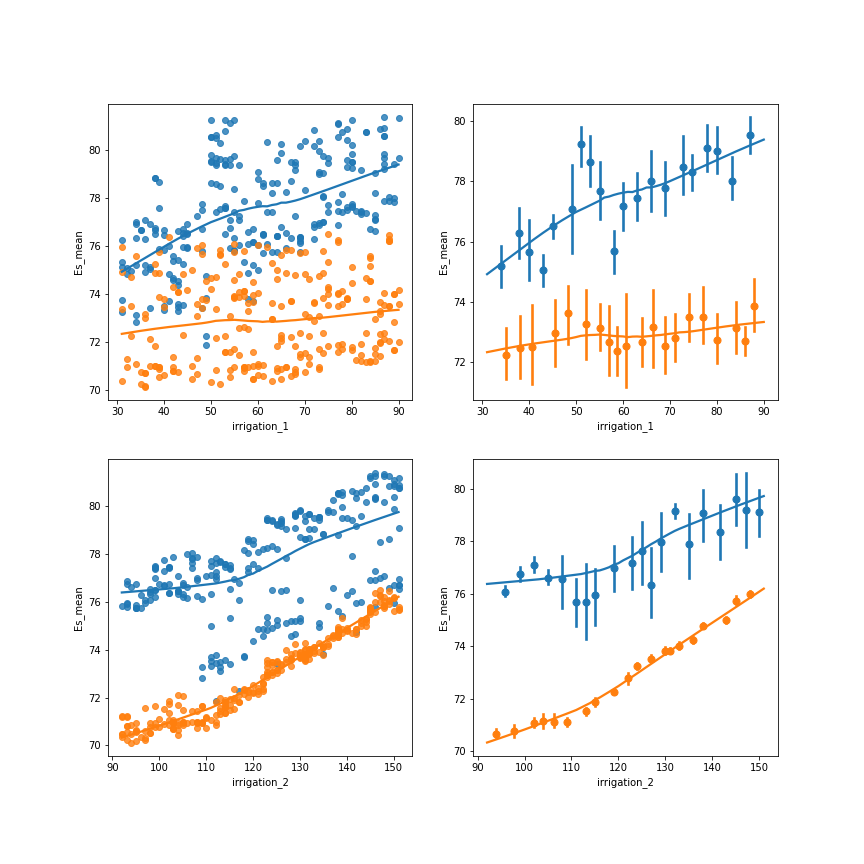
Fig. 21 Regression plot of 250 runs of 10 mm and 25 mm irrigation depths irrigation dates chosen randomly from the intervals [15 Jan,15 Mar] and [16 Mar,15 May] Top represent plots against the first irrigation date, Bottom row plots against the second irrigation date. Organge is 25 mm irrigation, blue is 10 mm irrigation.#
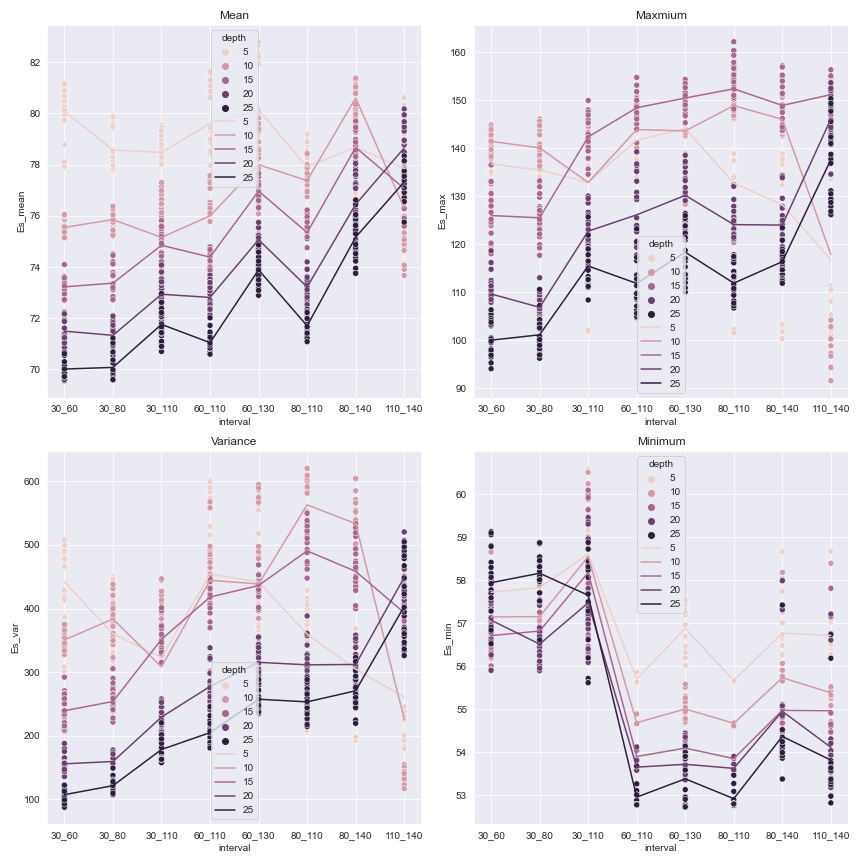
Fig. 22 Different statistics for each chosen interval. The scatter plots represent the actual values for each random date pair, the line represents the mean value in each plot.#
Biomass#
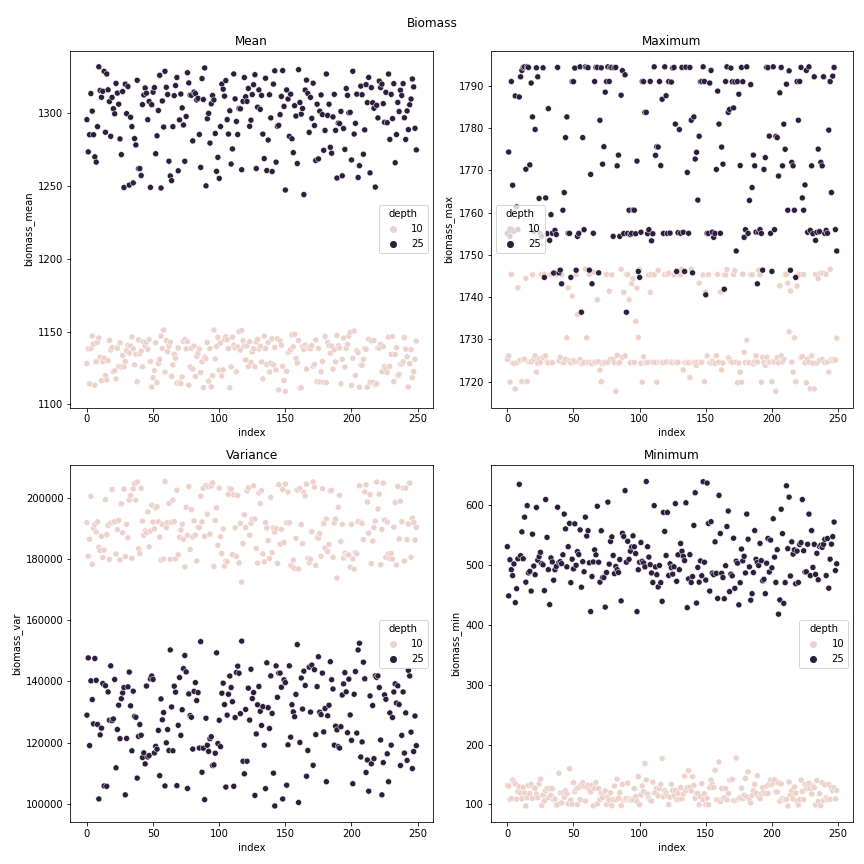
Fig. 23 Fig. 4 Aggregation of 250 runs each of 10 mm and 25 mm irrigation depths with irrigation dates chosen randomly from the intervals [15 Jan, 15 Mar] and [16 Mar, 15 May]#
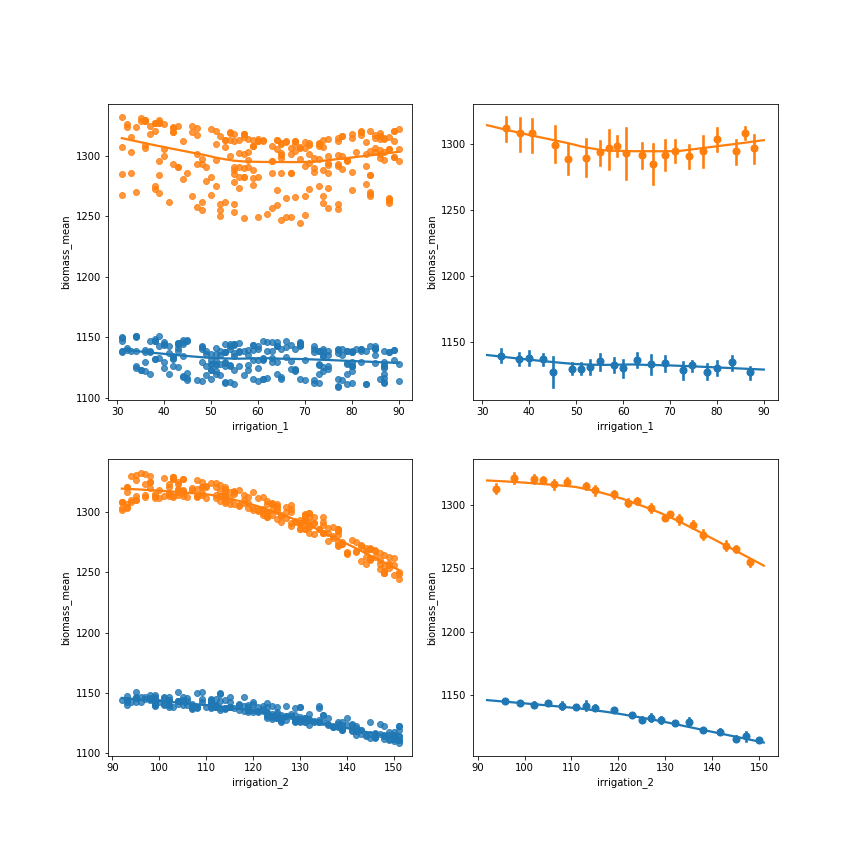
Fig. 24 Regression plot of 250 runs of 10 mm and 25 mm irrigation depths irrigation dates chosen randomly from the intervals [15 Jan,15 Mar] and [16 Mar,15 May] Top represent plots against the first irrigation date, Bottom row plots against the second irrigation date. Organge is 25 mm irrigation, blue is 10 mm irrigation.#
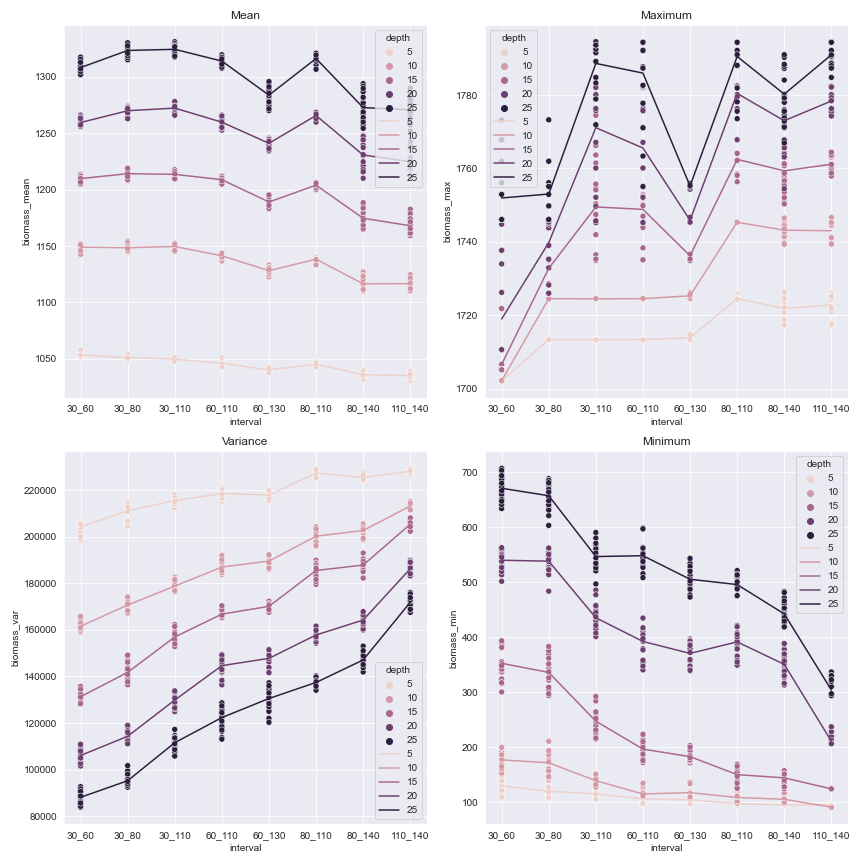
Fig. 25 Different statistics for each chosen interval. The scatter plots represent the actual values for each random date pair, the line represents the mean value in each plot.#